Try Ruby

I want to go ahead and ask, right off the bat, that any scholar/researcher that has found this blog post: I’d like to invite you to join my alpha testers on my Gentle Introductions Resource: https://boiling-wildwood-9939.herokuapp.com/

It has been quite a while since I posted on this blog, and looking at it, I believe there is a clear distinction from the posts I’d been writing when I had been in a class (this blog began as a required supplement to a DH course), and the posts I was trying to write while spending the bulk of my time solidifying the foundations of my MALS thesis.

Looking at my lasts two posts, it strikes me as rather funny that I have now failed at picking a traditional piece of literature as a foundational aspect of my thesis, nor have I truly mastered Python.  Instead, shortly after writing the last post I had found myself incredibly frustrated with Python.  I never could get it to deploy correctly on Heroku (the platform I’ve used for deploying apps).  As a result, I got nervous… very nervous.  I started pouring through Christopher Marlowe’s Faust, believing that I could simply write a traditional paper on some British literature and perhaps “mark it up nice” with some Python syntax: easy enough but disappointing.  But what could I do?!  Time was now of the essence, summer was over!

Then a friend of mine suggested I “try Ruby.

Believe me, I had no interest in looking at another computer language.  I had already spent so much time with R and with Python… another languge?  I felt the school semester had already started, I had spent all summer learning Git, and Python, and PyGame, there was Django… I was NOT going to jump into another language… but then I saw this:

2007-cover-open

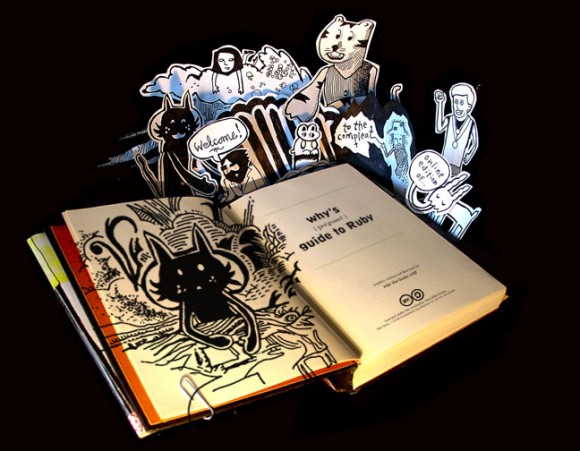
Figure 1: _why’s Poignant Guide to Ruby

This online book made me so excited to try learning a language.  I had been so tired of montanous manual-speak I found in many Python manuals, and here was this pseudo graphic novel that was just so fun; So appealing.  I decided, because I really wanted to savor this book, that I would take a couple hours to go through a more direct tutorial first.  I found one completely by accident, The Rails Tutorial by Michael Hartl:

699423-ruby-rails-3-tutorial-learn-rails-example-michael-hartl

Figure 2: Michael Hartl’s Rails Tutorial

This all took place in a day mind you, but two weeks later I had the beginnings of a working “web app” developed in Ruby using Rails.  All the things I had learned while pushing my way through Python were starting to click, and now I was looking at a language far more beautiful… which might sound strange.  This programming stuff begins to have an ineffable aesthetic.  Here is a selection of Python Code:

Screen Shot 2013-11-25 at 5.49.27 PM

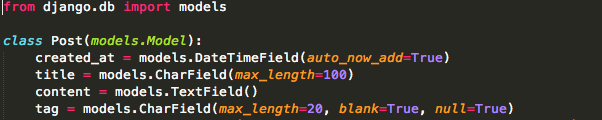
Now HERE is a selection of Ruby Code:


Screen Shot 2013-11-25 at 5.47.51 PM


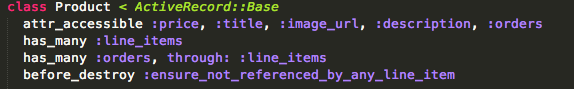
Now, this is a subjective belief, that Ruby is a nicer code.  I’m sure there are plenty of Python enthusiasts who would call it nothing but pure myth.  But this is all part of the mythos of the Ruby Language, but the fact that it had such a thing that it seemed to have breathed from the moment I saw two cartoon foxes as protagonists in a book teaching a computer language.

wixl-1

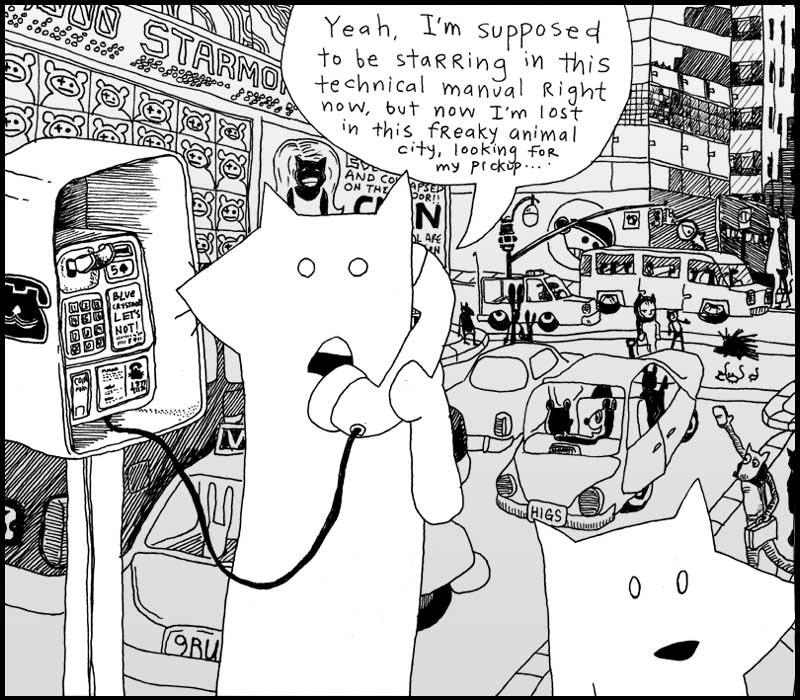
Figure 3: from  _why’s Poignant Guide to Ruby

Python, it seemed from my vantage point, was a nod to a British TV show and a practical, usable code.  Ruby on the other hand seemed to have a whole slew of creatives excited about making the language itself and a community of thinkers be part and parcel.

I had started using the language in a purely trepedatious way, as if it were a curiosity during a panicked moment of procrastination, but because I had struggled with concepts that all either had direct meaning when using Ruby (Git) or could be easily transitioned from one language to the other (Django => Rails)… Ruby was this breathe of fresh air; Something new and shiny that spoke to me.

Now I think the same thing might have happened to someone that might have jumped into Ruby, not felt at home, and then discovered Python. The point I’m making with my little write up here is that it can take a lot of time and hard lessons to point one in the direction that they find most self-defining or at least relevant.  Now I’m sure there is someone that learned Ruby right away, in a classroom, and is so glad they did and smirks when someone says they learned it on their own.  I definitely have my share of issues when sitting down to speak with a seasoned programmer, but I think it is okay for a Digital Humanities program to encourage exploration of the field over a direct route incensed with imagined mathematical perfection when it comes to digital mediation and control over such things.

But I’m not getting on a soap box, I’m just wrapping up with the thought that perhaps it is okay to find your own path through personal filtration of a lot of information.  Or anyway, whether it is or it isn’t, that is what I did.  And I’m really enjoying this language.  If you want to see more things I’ve done with it, here are more links:

Gentle Introduction Resource

Anderson’s Comic Shop Engine

Jekyll blog

And there are other things still in my development environment that run in my terminal, not yet on the web.  I have been very productive in this language.  I even received a scholarship to attend RubyConf ’13…

Screen Shot 2013-11-25 at 6.14.35 PM

Figure 4: RUBYCONF 2013 logo

Don’t worry, I didn’t hose them acting like I’d been using this language forever, I confessed I was a Ruby NOOB, but the community respected a MALS researcher interested in getting thoughts about the language straight from them.  It was an incredibly nice crowd, full of experts and veterans, but plenty of curious new practitioners that had found the language the same way I had: through trying to learn something new and challenging.

Posted in Uncategorized | Comments closed

Forbidden Knowledge: The Important and The Insane

Sometimes when working on creating an elegant infrastructure for housing a Digital Humanities project, I’ve found it is easy to forget the importance of researching the actual content I am hoping to aggregate. Here are some of the research items I have been engaged with most recently. The key theme in each of them is “Forbidden Knowledge” which I think gels nicely with much of my intentions of contributing to DH pedagogy in regards to coding:

Films:

faust_1
http://www.youtube.com/watch?v=muQmMcju82A

Books:

ov

From Barlowe’s Guide to E.Ts

Childhood’s End  by Arthur C. Clarke

Caleb Williams by William Godwin

Historia von D. Johann Fausten

Doctor Faustus – Marlowe, Christopher – Edited by F.S. BOAS

The Sin of Knowledge by Theodore Ziolkowski

The Dead Sea Scrolls (Primarily Book of Enoch)


These readings/viewings stir a number of reservations about how to communicate information, about how to link some of the strange connections I’ve mapped in these works. In the Faust legend I find what looks very much like an immortal series of stories crafted around some kind of eccentric, audaciously irreverent comedian. This narrative of a scholar that sells his soul to the devil is most likely a myth formed because a brilliant huckster took great pains to “shock” the world around him. In Caleb Williams we find damning information held by the powerless. Godwin’s subtitle: Things As They Are — is a telling moniker in this tale of the innocent being guilty merely because of his social status. In Childhood’s End Clarke creates a myth of powerful extraterrestrials that take benevolent control of the earth though they appear as medieval demons as classically illustrated by humanity.

The string that ties much of these works together was far more eerie/uncanny than I had expected it to be when my research began, but I think there is important work to be done in the study of some of the odd symbology that peppers much of Western culture’s archetypal narratives. There seems to be an odd undercurrent of schizotypal paranoia sweeping through this nation in particular. It seems that people are quick to turn to the ineffable when they encounter a symbol of culture they fail to understand, and the ineffable is communicated as powerful, aggressive, and cruel.

For example, while on one hand we have what I would call warranted fear about information that is forbidden us by and about the overly powerful:

http://www.theatlantic.com/politics/archive/2013/07/a-terrifying-sentence-from-the-latest-edward-snowden-leak-story/278234/

But too often such information is linked to postmodern-ized paranormal mythos/deviant paranoia:

http://www.theatlanticwire.com/national/2013/04/12-million-americans-believe-lizard-people-run-our-country/63799/

The symbology of misinformation and the dissolution of duty through aligning the traumatic with the insane often seems to be an impenetrable force of networked society, and I would argue there is a need for humanities based exploration of the origins of some of these odd tendencies of information dispersal.

Perhaps much of what I describe in this post is the kind of meandering that could easily go beyond the scope of my final thesis, however my own notes and explorations of these texts are currently “keeping me in shape” as I try to streamline what kinds of content I will be harnessing within some of the web frameworks I’m spending the bulk of my time researching. I like to think privately “gaming” the impenetrable, obscure, taboo, and obscene with some academic vigor can be helpful in the problem solving process that comes along with trying to build and debug computational programs, frameworks, and snippets of code.

Posted in Uncategorized | Comments closed

Python 2.7-32’s Coding Circus

*Warning this blog post is best described as a free writing exercise.  It started out as an attempt to describe issues of utilizing multiple versions of singular software, and quickly turned to ridiculous images and cathartic gibberish.  You have been warned.

My brain does indeed hurt while trying to install all this crap!

I‘m taking to my academic blog to vent, because my only other option is running to StackOverflow where I’ll be called out as a “newb” a “moron” or “Here is some insanely difficult thing you can do that takes this commenter only 7 seconds to accomplish.”  No thank you.

Lately I’ve been running into a problem with bloating up my computer with things, more things, and multiple versions of singular things.  Some of you working through similar attempts in the vast digital wasteland might be feeling my pain.  I’ve been doing a lot of work with Python, and I’ve been doing it all alone… Sometimes I wish I wasn’t, but that is fodder for another time.

3702

Here is my current issue.  I’ve been making some programs with Python all summer.  I’ve not gone to conferences, I’ve been freelancing from home (semi)successfully for a few shillings a week, and I have (like an insane hermit) been trapped inside an East Village apt face to face with only the command line trying to “beat the machine” as I call it.  I can go back to the programs I’ve been cobbling together since the beginning of the summer and feel some satisfaction.  Its a nice feeling that lasts only seconds, as quickly I’m overwhelmed by the next hurdle toward doing something with any kind of relevance.

My latest lament: I have to use a ’32 bit’ version of Python for libraries in Pygame (a game-making library) and wxpython (a GUI library).  I’ve been wanting a way to push my work to the web beyond raw code as seen in my GIT repository (http://www.github.com/elicash82).  It seems a popular way to do this with Python is a web framework called Django.  After hours and hours of installing new versions of mysql and other programs that connect this database framework with the Python language, I finally threw my hands up, but as I did, something interesting happened.  A program that I had been unable to even begin to install suddenly did not seem so difficult.

Wow, I am doing a terrible job at streamlining this, how about I just list what I am trying to get across:

1. Coding is not the primary focus of the DH community at large, and from a personal vantage point, I think this is a mistake.  I know the issue is that (pardon my obscenity) this shit is hard.  This shit is hard for me, and I’ve had a computer for, like, forever.  So for those that have never had a computer, I imagine this shit is damn near impossible.

2. The more you know the less you know:  For instance, I now know that I need a 32 bit version of Python to do some things, and a 64 bit version of Python to do others.  I know I have at least 5 versions of Python on this computer, 4 of which I don’t want but I am afraid to delete.  I don’t even REALLY know what the difference between 32 bits and 64 bits is in this scenario, AND I’M NOT GOING TO WASTE TIME FINDING OUT!  I know how to make a full featured webpage in HTML, yet can do little more than write “Hello World” on a webpage in python… and I need 2 different pages of code.  I know that I don’t know so much at this point I can’t remember if I used to know anything that I might not know now.  I… What am I saying?  Go ahead and skip to number 3, I have to collect my thoughts…

3. If you DON’T learn the hard truths about the things you don’t know that you don’t know, you are going to get a terrible case of Dunning-Kruger (which I speak about in my Gravity’s Rainbow post).  This is what I think is the biggest issue facing the world of Digital Humanities.  I can’t tell you how many students I’ve run into that think that they understand contributing to the digital world, but all they are doing is spouting off their issues inside of content management systems (like the one I’m using to post this rant… Lo, sweet irony) or using a soon to be outmoded piece of proprietary software that they’ll never be able to port their work out of.  But again, coding is hard shit. Reading Goethe is hard shit.  Reading Goethe, coding, and holding down a job are pretty much impossible to do all at the same time.

3nDuEdn

4.  There is no rule number 4…

5. Doing this and taking breaks to read a selection of library books, currently including: “Literature and the Occult”, “The Sin of Knowledge”, “Asimov’s Foundation”, and “Marlowe’s Faust” is invigorating.  Instead of working through tutorials typing things like “Hello my name is Joe” or writing a program that is word for word from one of these templates about “Gothons from Nebulan 7: a text adventure game” I have used the same techniques to build a command line portfolio of my entire personal library of books and a way to assign them monetary value, as well as ways of assigning several lists of 17th century codexes value.  I’ve created interactive modules using 18th century illustrations that can now be interacted with ludically.  etc etc etc

END OF LIST——>

Jesus, okay, so that list was still incredibly rambly.  I should just delete it, and only write the following list, but then you’d probably miss my actual point.  I’m going to try this one more time, and then I’m logging off of here:

1. Coding = Hard

2. The more you make things, the more you break things

3. The less you break things the more you think you wouldn’t break things if you did decide to actually make something on your own.

4. if Coding.makingThings = TRUE then Coding.breakingThings >= Coding.makingThings ELSE: Dunning Kruger(self)

5. The single most rewarding experiences I’ve taken from coding in Python is having the ability to manipulate rich, timeless, scholarly content in ways most Humanities scholars have not yet figured out without corporate low-level handholding.

tumblr_mh9iv7Qoo31r52he3o1_500

Posted in Uncategorized | Comments closed

Final Projects:

For my final two projects as a Masters candidate at the Graduate Center I am working on:


A) Thesis:

Because I am in the Digital Humanities concentration within the MALS degree program I have the opportunity to “build something” rather than simply writing out a typical Masters Thesis.  This summer has been a lot of head banging and trying to figure out exactly what I want to build, as well as some real leaps forward in Python experimentation.

While what I’ve done with the “pygame” library has been the most visually stimulating (I can create an avatar and a background environment, make this token character move in all directions, even apply gravity to the environment and have my avatar hop around as I press arrow keys and the spacebar), just attempting to write a program in python without fancy libraries I feel has been the most personally gratifying.  I’m really starting to understand the core concepts of programming in an object-oriented manner.  That said, I really wish I could add windows, buttons, and the basic Graphical User Interface (GUI) to the text programs I am making with as much ease as I have been able to do basic things with the pygame library.

My advisor, Prof Matt Gold, has pointed out I need to get on the ball with coming up with an “elevator pitch.”  This is a much harder task than I expected it to be.  Each step forward I take raises so many new questions.  The real pitfall I’m experiencing is the fact that from a time-table perspective it is time for me to be concentrating on content.  But because I am pushing the limits of expectation, I’m often second guessing myself when I come to a topic.  So far this is a list of possibilities I’ve run through:

1. Caleb Williams by William Godwin – Creating a text based or even non-text based (graphical) game based on this famous novel.

2. PROTO – A ludic exploration of public domain canonical texts that utilize tropes that the science fiction genre arose from.

3. CodexFolio – Originally a non-academic project I’ve worked on in which I build a program that analyzes the value of published books from an investment/historical standpoint.

4.  ???

B) ITP Certificate Project: The Gentle Introduction Resource or GIR:

I’ve done less work with this over the summer because I’ve done a lot more preparation as far as what I’d like this to be.  The one big change I’ve made from my original white paper is that rather than a website, again I’d like to turn to python.  This is because I feel it tiresome to try and deal with creating a website that requires logging in, credentialing-to-alter, and other problematic schematics.  If I build a program that can be pushed to github, that makes it so the barrier to entry for editing the GIR is simply the ability to fork a gitHub repository which is not so simple a task.  It also encourages the use of versioning simple software.

What the GIR is (in a nutshell): is a resource for giving burgeoning digital humanists ways of exploring techniques rather than just jumping into the Google void willy nilly in hopes of finding the right tool for their issue.  It would not be the first of such resources, but I think it has a relatively novel approach.  There are a lot of gentle introductions out there, often written by and for the academic scholar.  I think too often the highly educated humanist backs away from a lot of bare bones computational tools simply because so many are directed at “Dummies” “Idiots” and “Kids.”  My hope is to create something engaging and mature that tackles some of the most introductory stages of programming with the humanities scholar in mind.

There are a lot of great academic writings on introducing one to coding as a tool out there, and this would basically wrangle such writings together in a(n) (arguably)  high level, but alterable way.

——-

So this is what my summer has entailed.  To view the raw code I’ve been putting together please check out my GitHub repository:

http://github.com/EliCash82

Posted in Uncategorized | Tagged , | Comments closed

Exploring Gravity’s Rainbow

1. Initial Goal

GR31
My initial goal for this project was fairly straightforward – find a way to use our methods from class to gain a deeper understanding of Gravity’s rainbow – considered the pre-eminant postmodern text of the 20th century. This encyclopedic tome holds in it the kinds of deep structuring that is immidiately relevent to mathematical/computational examination… something I was not finding in initial public domain works. A perfect argument for the idea that the importance of digital humanities methods becomes much starker once the postmodern narrative comes into being.

2. Experimentation

rocketsRainbow

My first experiment with the book was simply to measure some word frequencies in the book using a tutorial from DHer Matthew Jockers. Searching words like “rocket” and “Slothrop” I was able to graphically plot the distribution of words. At that point I had not done enough close-readings of articles to understand how to get a meaningful set of “tokens” in which to use these methods to test a theory. If I could go back I think I would almost certainly plot specific tarot card titles. I may still go back and do this, but the more close reading I did, the more I found that there are scholars that contend the text holds specific hints that each section of the novel focuses on a different tarot figure.

3. Mathematics

Screen Shot 2013-05-12 at 2.54.00 PM

Power Series (Pynchon, 142)

Screen Shot 2013-05-12 at 2.54.42 PM

Yaw Control (Pynchon, 242)

Screen Shot 2013-05-12 at 2.57.26 PM

Hilarious Graffiti of the Visiting Mathematicians (Pynchon, 457)


My next inclination was to examine the three explicit equations in the Gravity’s Rainbow text. This desire was spurred on by the reading of Lance Schachterle and P.k. Aravind’s article, “The Three Equations in Gravity’s Rainbow” Can these equations say something deep/new when somehow applied to data from the novel? I knew I would certainly not have time to examine all three in a tight time frame, so I chose the first of the equations – The Power Series – the most statistically relevent (as the R language I’ve been attempting to employ is traditionally software for statisticians).

4. Accepting Realities

Dunning-Kruger

via http://artandtechnology.com.au (*Pretty sure ‘No Nothing’ is an intentional joke…)

After more research I began to feel I was suffering somewhat from the Dunning-Kruger effect – defined by wikipedia as a “cognitive bias in which unskilled individuals suffer from illusory superiority, mistakenly rating their ability much higher than average.” The reality is I was trying to rush headlong into a brand of mathematics I hadn’t worked with in more than a decade. This is not to say my research was in vain, far from it, merely I realized I had to put on the breaks and start handling my goals with gentler expectation.

5. Research Amalgamation 

366

From Zak Smith’s Gravity’s Rainbow Illustrated

Rather than jumping headlong into trying to make sense of “The Power Series” I examined the text around it. The statistician, Roger Mexico, one of the 400 characters in Gravity’s Rainbow, was trying to examine data that inexplicably showed a correlation: The location of V2s dropped on London, the location of London births, and most importantly to the novel – the location of hardons/sexual encounters had between Tyrone Slothrop and a cavalcade of women. Tyrone Slothrop is the novel’s protagonist, but let me also say that this is the kind of text immune for a simple summarization. Tyrone Slothrop is explicitly a US Leutenant, but he may also be the ONLY character in the book, he very well may be a V2 rocket himself – attaining some kind of mad conciousness capturing some kind of abstract zeitgeist as he rises and falls as represented by a carefully constructed narrative. For every scholar that has attempted to study Gravity’s Rainbow there is a different interpretation of what exactly is happening in the text.

Screen Shot 2013-05-05 at 1.51.33 AM

My last attempt to utilize methods was one step forward, and three illusory steps backward. I had to simplify my expectations based on time I had left to work on this project before presenting, and what my current skillsets were (are). I would find a way to recreate the map constructed by Tyrone Slothrop:

“The stars pasted up on Slothrop’s map cover the
available spectrum, beginning with silver (labeled “Darlene”) sharing a
constellation with Gladys, green, and Katharine, gold, and as the eye
strays Alice, Delores, Shirley, a couple of Sallys—mostly red and blue
through here—a cluster near Tower Hill, a violet density about
Covent Garden, a nebular streaming on into Mayfair, Soho, and out to
Wembley and up to Hampstead Heath—in every direction goes this
glossy, multicolored, here and there peeling firmament, Carolines,
Marias, Annes, Susans, Elizabeths. But perhaps the colors are only random, uncoded.  Perhaps the girls are not even real”(Pynchon corpus, 682-691).

“It’s the map that spooks them all, the map Slothrop’s been keeping on
his girls. The stars fall in a Poisson distribution, just like the rocket
strikes on Roger Mexico’s map of the Robot Blitz.
But, well, it’s a bit more than the distribution. The two patterns also
happen to be identical. They match up square for square. The slides that
Teddy Bloat’s been taking of Slothrop’s map have been projected onto Roger’s, and the two images, girl-stars and rocket-strike circles,
demonstrated to coincide. (Pynchon corpus, lines 3211-3217)”

ant_map_large

via http://www.v2rocket.com/start/chapters/antwerp.html


_40048350_v2_rocket2_map416

via http://newsimg.bbc.co.uk/media/images/40048000/gif/_40048350_v2_rocket2_map416.gif


Screen Shot 2013-05-12 at 3.28.02 PM

via http://bombsight.org/

However the deeper I looked, the more I found that while mathematical and data-centric devices employed in the book were valid one of two possibilities make the construction of this map either impossible or impossible for me. Why?:

1. The events of the book take place between December of 1944 and September 14 1945.
2. The final fall of the V2 rocket on a movie theater mirrors the Antwerp movie theater bombing of December 16, 1944.
SO: Time AND space are being played with through interconnecting implicit and explicit mathematical structures that would take years to correctly interpret (for this guy anyway)
or
SO: Pynchon is using his own fictional data and a precise recreation of this data in visualized form is impossible based on what the book reveals.  This fictional data’s resemblance to actual data alongside valid mathematical structures in and around mathematical structure communicates ineffability/paranoia to the uninitiated reader, and black humour to the engineer.

325px-Poisson_pmf.svg

via http://en.wikipedia.org/wiki/Poisson_distribution

6. Conclusion

My failure to produce/make a neat, pretty visualization based on expected findings was a personal lesson in “ways of learning” in connection to digital pedagogy. In my attempt to construct a virtual “thing” I would contend I learned as much or more about this novel than I would have writing a traditional paper.
-In creating constraints that were interesting to me personally, I was exposed to a large number of visualizations showing how devestating the bombings in London during the second world war truly were.
-I learned more deeply about how a Poisson distribution is used and the difficulties in implementing such a distribution when trying to move beyond its simplest examples.
-I found structural clues worthy of further exploration (tarot references, pop culture references, etc)

If I had done a traditional close reading in today’s research environment in hopes of writing a paper, I no doubt would have been drawn to the most strictly literary reading possible. I would seek out symbols, nuances about specific characters, forms that could be recapitulated and regurgitated in a way that is all too prevelent in today’s more traditional forms of humanities scholarship. My drive to examine specific forms through utilization of empirical computational questions.  I did as much, if not more, close reading as I would have crafting a traditional paper, yet the span of concepts I found outside those constraints I found to be just as informative, and in many cases more edifying.  My ability at building maps in the R language for example was raised, my understanding of some (admittedly simple) distribution concepts grew in clarity.  By moving outside of the text/explicit references to the text to ponder questions raised by the text was a valuable lesson on levels that a traditional paper would most likely not have satisfied.

Posted in Uncategorized | Comments closed

R Mapping Tests

Moving forward with my project:

Right now I am still trying to get a proper map set up in R. I pushed away from QGIS, which I’ve messed with a little this semester after installing it on my linux laptop. I don’t want to sound repetitive on this blog, and I have emphasized the fact that I think using R as much as possible is imperative for my own goals.

An article at R-Bloggers, shows that I’m not alone in my belief that R holds a an immidiate relevence: <http://www.r-bloggers.com/how-r-grows/> This article talks about how few packages (the programs that gives the R language its core functionality) were available before 2012. While the language itself has been around for quite a while, it has obviously found its audience only recently. The article also speaks about how much those using those packages owe to volunteers that host the packages a great deal of thanks.

That said, I’ve recently been having a lot of issues with my “mapmaking” in R. I’ve found a few options for a design of a London map to illustrate Pynchon’s Power-Series Distribution / The Slothrop Hardon Map. Below are a handful of my results. I’d post the code to go along with it, but it needs cleaning and proper citation of tutorials used, but I will post it before the semester’s end.

Screen Shot 2013-05-05 at 1.45.49 AM

see http://cran.r-project.org/web/packages/maps/maps.pdf


Map 1: This map is one easily pulled with the R “maps” package.  I simply pull the specified “uk” vector from the supplied world map.  But, believe me, this guy blown up is far from pretty, so I didn’t even bother.

Screen Shot 2013-05-05 at 1.34.56 AM

see http://cran.r-project.org/web/packages/RgoogleMaps/RgoogleMaps.pdf


Map 2: The Google map.  This one is not difficult to pull with the package “rgooglemaps”, but besides the fact that this map has far too much modern data, it is also another Google labelled map, and I want to stay away from that.  However, I think further investigation is warranted.  Another map that came up later was constructed at least in part thanks to Google Fusion Tables.  The ability to zoom in on London was more of a success than I initially realized when compared with other attempts

Screen Shot 2013-05-04 at 9.24.34 PM

Map 3: I was able to create this map thanks to a tutorial, however I wasn’t able to move beyond.

Screen Shot 2013-05-05 at 1.51.33 AM

see http://spatial.ly/2010/09/maps-with-ggplot2/


Map 4: Obviously the most attractive of what I’ve been able to throw together, but I’ve had a rough time pulling this map away from the tutorial mediated data insertion.  This map was built with a package that makes visualization in R far more attractive.  Check out “ggplot2” if you are interested in knowing more.

Screen Shot 2013-05-05 at 4.26.37 PM

see http://www.r-bloggers.com/mapping-primary-care-trust-pct-data-part-1/


Map 5: This map of the UK was also done in ggplot2, but the tutorial it was pulled from showed a bit more promise to my purposes… or at least I think it did?

So there you have it, I have some fun looking skeletal maps to start with, but the real difficulty comes in inserting my csv files with coordinates into R via ggplot2.  I’m going to move onto trying to simply plot the lat/long of bombing points, and then hope that layering the information on top becomes easier.  I’ve come close with some tutorials not discussed here… I think I’m a week away from seeing what I want to see.


Posted in Uncategorized | Comments closed

twitteR Visualizations

ducktales

I’ve been enjoying my time in Lev Manovich’s Big Data class this semester, and I am currently working with R to create some visualizations of twitter trends with a package called twitteR specifically for my final project in Prof Manovich’s class.


This is a particularly difficult package to find good tutorials for.  Why?

  1. Search engines, Google included, do not have a case-sensitive search option.  Typing “R” and “Twitter” are not going to bring up any relevant information, (I found the most success typing “R language” and “twitteR package” – quotes included)
  2. Twitter’s original API allowed for manipulation of XML data which was heavily used in earlier twitteR experiments, most of which rise to the top of any search that is not time sensitive.  I recommend searching “The past year” only.
  3. There is far more information available for just getting this package running than there are practical uses of the package


That said there have been two tutorials that have been especially helpful for me.


The first is just the general package description titled “Twitter client for R” by Jeff Gentry.  This is essential for a general introduction to the package.  It can be found here: <http://cran.r-project.org/web/packages/twitteR/vignettes/twitteR.pdf>


The second which I will be posting examples of my work with is called “Getting Started with Twitter Analysis in R” by AJ Hirst and can be found here: < http://blog.ouseful.info/2011/11/09/getting-started-with-twitter-analysis-in-r/>


For my final project in Prof Manovich’s class my current intention is to examine several aspects of the valuation of comic books from the sixties.  I’ve built a dataset of the most popular 108 titles between 1960 and 1969.  While some of these cultural artifacts are valued at thousands of dollars, others can be purchased for less than ten dollars.  I’m curious as to where I can find some correlation between the value of these comics and trends in their popularity on the twitter network.


Because I’ve already alluded to my ineffable obsession with Scrooge McDuck on this blog, and this character seemed to rule the roost as far as nineteen-sixties comic book sales are concerned, I’m going to first run some analysis on the hashtag #Ducktales. (While Ducktales was not the title of any of the Scrooge McDuck comics, all the episodes of this program, including a motion picture, are based on the story lines found in the “Uncle Scrooge” comics)


The following .pngs illustrate the results I was able to construct thanks to the AJ Hirst tutorial cited earlier.  I’ve included PDF versions of my charts as well so as to make the data more visible.

My terminal window showing a dataframe of the data I am visualizing

My terminal window showing a dataframe of the data I am visualizing


Screen Shot 2013-04-29 at 12.56.32 AM

Visualization 1: Those who tweeted the #Ducktales hashtag the most from a collected random sample of #Ducktales tweets

PDF 1: ducky

A more streamlined collection of data, still need to study code to see exactly what was pulled out of initial data.

A more streamlined collection of data, still need to study code to see exactly what was pulled out of initial data.

PDF 2: ducky2

Posted in Uncategorized | Comments closed

Presentation Thoughts

For my final presentation in DH Methods I am going to be using as many of the skills we’ve dabbled in this semester as I can. My hope is to run some streamlined, computational explorations on a .txt file holding the full text of Thomas Pynchon’s Gravity’s Rainbow.

You can see on the page featured in Fig 1 a sampling of the substantial number of mathematic and statistical material used in the narrative, and I am hoping to utilize a full tool kit to pull some relevent information from the text.

Screen Shot 2013-04-22 at 1.59.30 AM

Fig 1: http://gravitys-rainbow.pynchonwiki.com

Possible Exploration Techniques Include:

  • XML/XSLT – At some point in the process, possibly for web publication purposes, I may markup portions of the text in XML.
  • RegEx – Going to go back through some general RegEx functionality so that I can denote positions in the text that I want to break down using…
  • R Language – I’ve been running some early tests on the corpus using R… I’ve been able to do a word count, and to take a number of words and map out their usage on a timeline, as the screenshot labeled Fig 2 shows:
rocketsRainbow

Fig 2: An R Visualization illustrating the chronological usage of the word “rocket” in Pynchon’s Gravity’s Rainbow

Much of the R code I’ve been experimenting with that is specifically relevent to those interested in playing with literature data, I found here: http://www.matthewjockers.net/materials/dhwi-2013/dhwi-code/

Posted in Uncategorized | Comments closed

Visualization

I’m going to go a little out of bounds in my blog post as it relates to my DH Methods Class. We are concentrating on Visualization in our upcoming class, something I’ve been trudging through weekly for the class on Visualization I am in that directly follows the aforementioned DH course. I thought I would share some of the visualizations I’ve been working with, as well as explaining some of the issues I’ve had as a humanities scholar.

1. Mondrian – This is the software we began with in the Visualization course. I was able to take some spreadsheets and build some interesting, interacting charts based on some bibliographic data I found in Google Books from the 19th Century… but this software was limiting, as really I was hoping to use visualization as a gateway to more high-level computation.

mondrianexamp

2. R – I sort of jumped right into this language when we started examining it, this statistical programming language has both a steep and not so steep learning curve to it. Not steep in that some basic functions can be picked up pretty fast. You can do several pretty quick “Hello, World!” examples… the steep learning curve, especially for someone whose interest in statistics wasn’t classically over-the-moon, comes in trying to put the language to good use. The initial charting of bar charts, scatterplots, and histograms was not the challenge, the challenge was analysis of these charts and implementing large enough data sets to come up with something interesting. I’ve got a saved scatterplot I built off of a relatively small (too small) data set.

Screen Shot 2013-04-15 at 3.58.45 AM
After following some explicit instructions I was able to transcribe this scatterplot with some standard regression techniques. I am still looking for my own dataset that is large enough to make some comparable visualizations that coincides with next semester’s final thesis for the whole shebang, but I am not there yet, I still have more techniques to review.

vantut

3. Pygame – This is sort of on my own time, but I think it is a fun idea to add some ludic exploration in what I hope shapes up to be a decent portfolio. I’ve taken a sprite from a Ducktales Nintendo game from back in the early 90s and I’ve animated it to coincide with pressing the keyboard arrow keys. Pretty basic stuff from the looks of it, but my learning R has helped me familiarize myself with what can and cannot be done with computational language (to a point)

scroogie

4. ImageJ – This is a fascinating program that I have just begun working with. Another program that necessitates Java (as have XSLT parsers I’ve mentioned before, and Mondrian mentioned earlier in this post). I’ve not worked with a lot of Java before this semester, but I have to say I hate dealing with it. There is always some sort of snag. With Mondrian, I was NEVER able to get the program to run on my Mac desktop and was satisfied getting it started on my Linux laptop. Now with imageJ, I’ve been able to get it to run great on my mac, but with Linux it is a pain in the neck. It would be hard for me to explain exactly what the issues are in a single blog post (especially since I’ve already attempted that), but the issue seems to be in trying to use these .JAR files which in some cases have important-to-mess-with-files packed inside of them like you might see in a zip file. There are ways to work with this in the Linux command line in ways that I’m sure are old-hat to most computer scientists, but for me it all seems overloaded. But I have to admit, these are very useful programs that have been written in the language.

More importantly, within ImageJ I’ve been able to make some really keen visualizations. Here is a selection of frames I pulled from an episode of the British sitcom Peep Show:

tumblr_ml5rskJ4Vc1s4q26go1_500

Well Jeremy, that is essentially how I feel about using this ImageJ User Manual.  You are in good company, El Dude Brother.

Screen Shot 2013-04-14 at 9.02.15 PM

I was able to eventually pull the entirety of Wes Anderson’s Hotel Chevalier:

tumblr_ml9l59DxBM1s7uhvlo1_500

“Did somebody say Wes Anderson?!”

Screen Shot 2013-04-15 at 3.45.34 AM

Both of these were made thanks to a handful of plug-ins I’ve yet to install on my Linux Machine.

So this is where I am at. It is probably clear that I have some work to do when it comes to using these tools for hard-nosed quantitative analysis, but this stuff is a rush to work with. I am either literally pulling chunks of hair out of my scalp or I’m inwardly cheering for myself when I finally get something working. Hopefully in the next month or so I’ll be able to slow down a tad and mesh some interesting writing with some well-formed data-vis… /p>

Posted in Uncategorized | Comments closed

I have tons of ideas, I have no idea.

tumblr_lxcke1dm8b1qltnbeo1_1280

I, too, may be misapplying the word “simple” these days… along with “pragmatic,” “practical,” “valuable,” and “reasonable.”


Rather than write specifically about software I’ve been testing, I’d like to take this opportunity to share where I am at with a personal DH project that I am working on.   I plan for this project to be of use in relation to both of the DH-centric courses I am taking this semester: Digital Humanities Methods 2 & Visualizing Big Data.  I worry if I do not do this now, and in the shared blog format, then I risk losing some key points of issue and success I have encountered during long hours of experimentation over the break.  While I found myself hardcore devoted to XML and XSLT transformations for several weeks, my latest obsession has been the R language.  I have found that the visualization techniques explored with this language are helping me to create very interesting data-based images that I hope to integrate into work wherein much of the web based presentation of these explorations will be done through XML to HTML transformations and encoding of texts with XML using techniques we have studied, notably RegEx to find specific highlights.
I may be getting ahead of myself here, and that is just because I’m sort of trying to sound all of this stuff out to myself.  I imagine that many of my classmates find themselves needing to do this on a regular basis.  The nice thing about all of these methods is that they remain unchanged, unlike my project ideas.  I have done my best to post some of the hurdles I am jumping in trying to hammer these new techniques out for myself, and I still plan to record some of my initial experiences in learning some basic R programming.  That said, let me try and take a few breaths here, and explain my line of thinking as I approach the moment where I need to be able to give a foundational answer to the question of what I would like to use these skills to accomplish:

Idea #1: The Scrooge McDuck Analysis
My first ideas are often my least practical, but the fact that I have had the opportunity to jump right into exploring assigned DH methods on my own terms has been both challenging and satisfying.  My attempt to scour some comic books in the desk drawer for some relevant data was not completely in vain, and it did lead me to some interesting findings.  Most notably I found that there are still some major headaches in data-acquisition when attempting to transform scanned printed material into digitally malleable text.  When seeing the trouble one has to go through, even with expensive OCR software, I realized messing about with old comic books might be a little flippant without a larger end-game in mind, so I tried to shift my lens to a more encompassing range when moving forward.

Idea #2: The Postmodern Database
When exploring methods of XML and XSLT transformations using oXygen, my initial attempt involved creating spreadsheet-based data on a small set of canonical works of postmodern fiction.  While this allowed me to play with data encoding on a very simple level, again I was left with the question: What do I want to do with this?– and once again my exploration of the materials I had in my developing toolkit seemed to offer an insight lesser than what the tools themselves promised.  This is because, again, the initial question I had was far too simple, and the question that developed became too complicated.  I began to think I could perhaps analyze something found nested in these postmodern texts, but being that few (okay, none of them) are in the public domain, the idea of finding full versions of these texts was an anxiety inducing idea.  Another problem became my realization that the prose itself is so experimental that perhaps I should move out of this arena for at least the time being.  I needed data that was more easily available for “playing with” and this data, while extremely playful in and of itself, was simply not readily available for me to use.  I needed some more readily acquired initial data that could be ported into the onslaught of new applications and methods coming to me from both my DH Methods class and Data-Vis class.

Idea #3: The 19th Century Metadex
At this point I had hit two specific walls of frustration from my two specific DH classes.  From my methods course: How can I acquire a collection of texts I might like to markup for reasons of close analysis with a digital flavor?  From my Big Data Vis course: How can I find cultural data with quantitative value that can be uniquely visualized?  I thought that if I could create a value scale out of a specific 19th century data set of Books about Books and superimpose (not sure if this is precisely the right word to use) full texts found in the gutenberg.org database I could offer scholars an interesting hub in which to pull some 19th Century information in a way that would lessen grunt-effort in a pleasurable way.  While I was able to find very interesting old data, it was hard to find new data that could match up.  None of the books that I had found in a collection of bibliographer indexes seemed to match up with latter-day value systems like LibraryThing or GoodReads.  I also began to see some warning signs signaling that my trying to place monetary data in relation to this data-set was also going to be damn near impossible, but more of that when I hit Idea #4.  Basically the dataset I had found was both too small to get any interesting results out of, and I found myself having little more than a YEAR to plot data out of.  Now I could have used concordance software to create numerical data out of word usage or character appearances and what not, but I was finding myself more and more drawn to the idea of valuation of texts, bringing me to…

Idea #4: The Billion Dollar Library
I found a NYT article from 1898 as linked to here: http://query.nytimes.com/gst/abstract.html?res=F30E1FFD3C5C11738DDDAD0894DE405B8885F0D3
This data I found interesting because it is a summation of two of the most expensive book auctions to take place in the 19th Century.  The data was old enough to where there could be no real Copyright issues holding me back from using it, and it came with some monetary data that I could explore with R Language visualizations I was at this point being expected to learn.  I thought it would be interesting to calculate rates of inflation from 1898 to the present day, and come up with how much each of these books went to auction for in today’s dollars (or pounds), and then have links to digitized versions of these texts (Hence my title The Billion Dollar Library).  I still think this is my best idea, however, I again found myself running into one of my problems from idea #1: OCR software and its current limitations.  While I found an entire book with dates and values of the entire Henry Perkins library, summarized in the NYT article, when running this book through OCR I found myself with more errors than info.  It would take me months to get this data inputted correctly, and even after that the data is very limited (it fills 3 columns, and one of those columns has no numerical value).  This is something I really do hope to come back to, but for now, I think I must move on once again

Idea #5: Idea number 5, there is NO idea number 5, Idea number 6… Nobody Expects the Spanish Inquisition?
I am taking a breather from idea-having for the time being and for my R language programming I am pulling provided data sets from a collection of databases (quandl, NY Open Data, etc).  As far as XML and XSLT go, I feel that I need to get back in there and do some practicing before I forget what I figured out.  This is one of my biggest issues: trying to make steady strides forward when juggling so many new techniques.  I often find in under-the-hood computing land, the biggest danger is forgetting what you already know.  I would definitely not equate programming, encoding, or most digital methodologies as akin to bike-riding.  Looking forward to more Geolocation methods in our next DH Methods meeting, though I’m wary to say I see myself using a lot of them in my major project, though I have found learning these methods to be VERY helpful.  They have guided me as I try to decipher what exactly the limitations are of vector imagery.  Vectors are very important in the R language, and I look forward to more and more vector usage, creation, and purpose.

Posted in Uncategorized | Comments closed
Skip to toolbar