I’m going to go a little out of bounds in my blog post as it relates to my DH Methods Class. We are concentrating on Visualization in our upcoming class, something I’ve been trudging through weekly for the class on Visualization I am in that directly follows the aforementioned DH course. I thought I would share some of the visualizations I’ve been working with, as well as explaining some of the issues I’ve had as a humanities scholar.
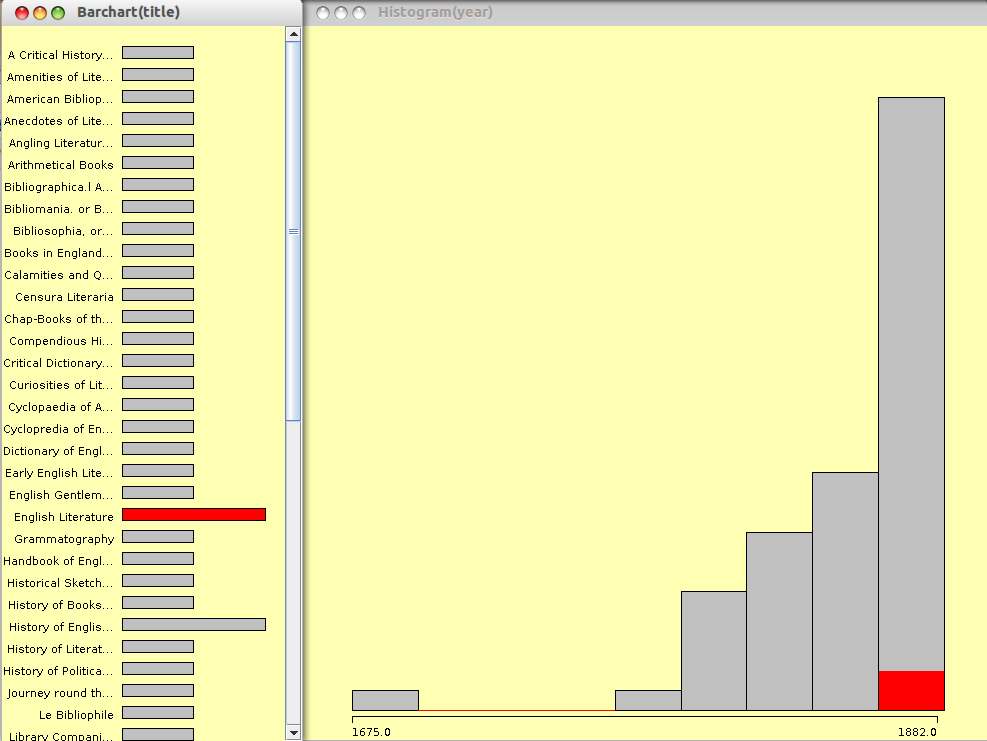
1. Mondrian – This is the software we began with in the Visualization course. I was able to take some spreadsheets and build some interesting, interacting charts based on some bibliographic data I found in Google Books from the 19th Century… but this software was limiting, as really I was hoping to use visualization as a gateway to more high-level computation.
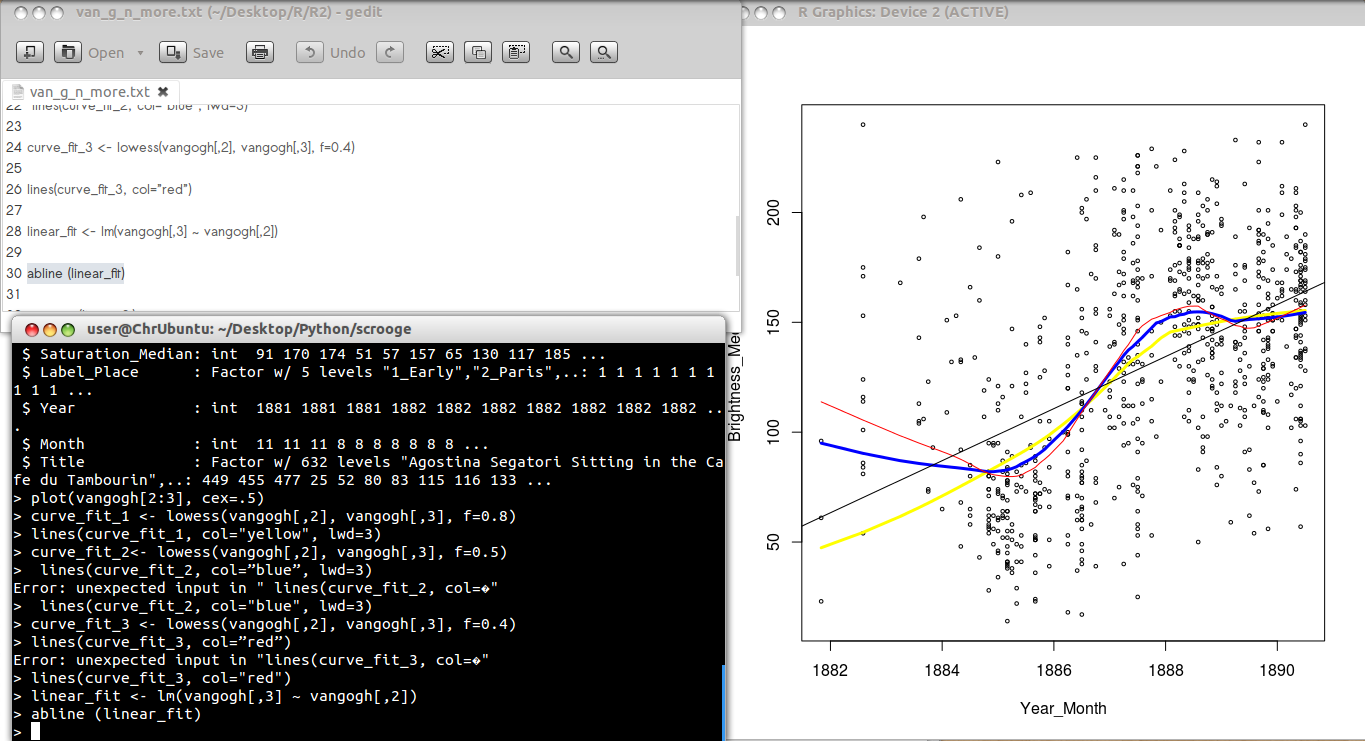
2. R – I sort of jumped right into this language when we started examining it, this statistical programming language has both a steep and not so steep learning curve to it. Not steep in that some basic functions can be picked up pretty fast. You can do several pretty quick “Hello, World!” examples… the steep learning curve, especially for someone whose interest in statistics wasn’t classically over-the-moon, comes in trying to put the language to good use. The initial charting of bar charts, scatterplots, and histograms was not the challenge, the challenge was analysis of these charts and implementing large enough data sets to come up with something interesting. I’ve got a saved scatterplot I built off of a relatively small (too small) data set.
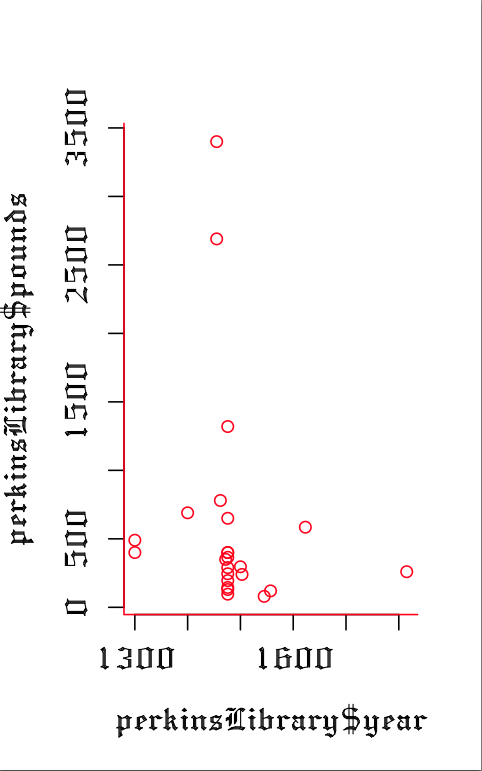
After following some explicit instructions I was able to transcribe this scatterplot with some standard regression techniques. I am still looking for my own dataset that is large enough to make some comparable visualizations that coincides with next semester’s final thesis for the whole shebang, but I am not there yet, I still have more techniques to review.
3. Pygame – This is sort of on my own time, but I think it is a fun idea to add some ludic exploration in what I hope shapes up to be a decent portfolio. I’ve taken a sprite from a Ducktales Nintendo game from back in the early 90s and I’ve animated it to coincide with pressing the keyboard arrow keys. Pretty basic stuff from the looks of it, but my learning R has helped me familiarize myself with what can and cannot be done with computational language (to a point)

4. ImageJ – This is a fascinating program that I have just begun working with. Another program that necessitates Java (as have XSLT parsers I’ve mentioned before, and Mondrian mentioned earlier in this post). I’ve not worked with a lot of Java before this semester, but I have to say I hate dealing with it. There is always some sort of snag. With Mondrian, I was NEVER able to get the program to run on my Mac desktop and was satisfied getting it started on my Linux laptop. Now with imageJ, I’ve been able to get it to run great on my mac, but with Linux it is a pain in the neck. It would be hard for me to explain exactly what the issues are in a single blog post (especially since I’ve already attempted that), but the issue seems to be in trying to use these .JAR files which in some cases have important-to-mess-with-files packed inside of them like you might see in a zip file. There are ways to work with this in the Linux command line in ways that I’m sure are old-hat to most computer scientists, but for me it all seems overloaded. But I have to admit, these are very useful programs that have been written in the language.
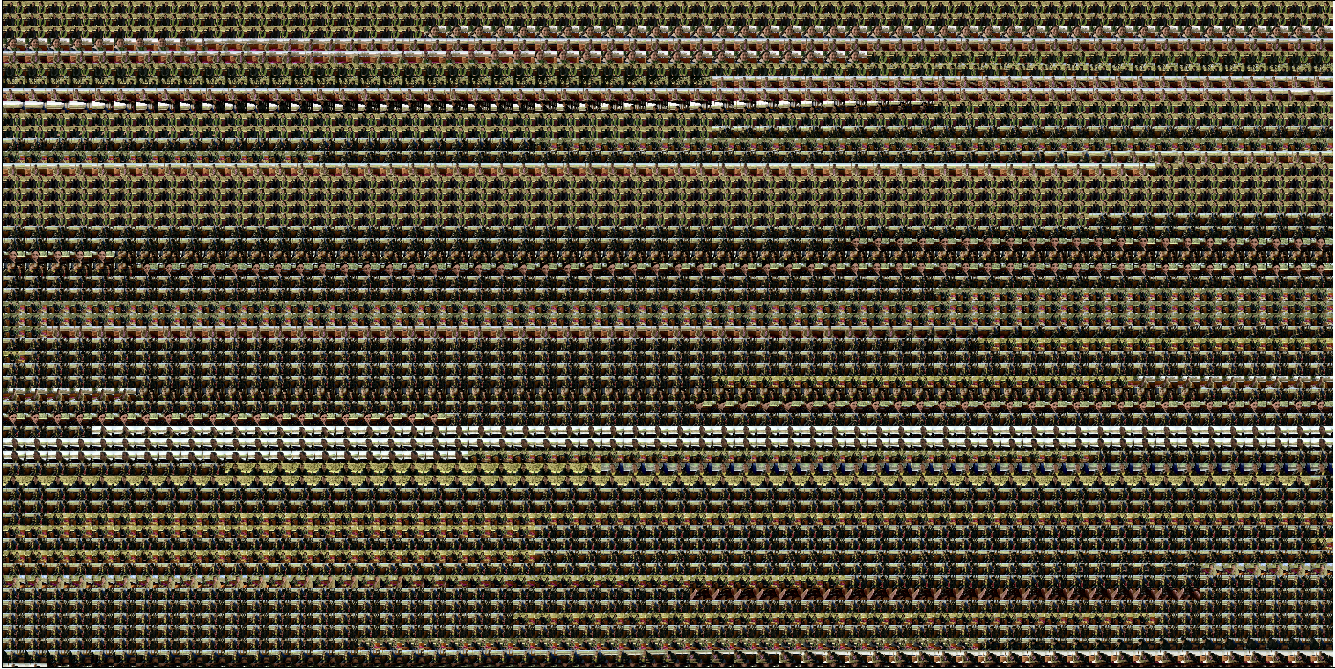
More importantly, within ImageJ I’ve been able to make some really keen visualizations. Here is a selection of frames I pulled from an episode of the British sitcom Peep Show:
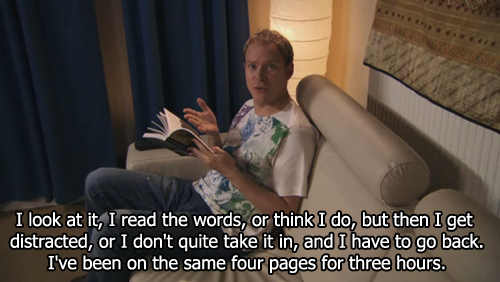
Well Jeremy, that is essentially how I feel about using this ImageJ User Manual. You are in good company, El Dude Brother.
I was able to eventually pull the entirety of Wes Anderson’s Hotel Chevalier:

“Did somebody say Wes Anderson?!”
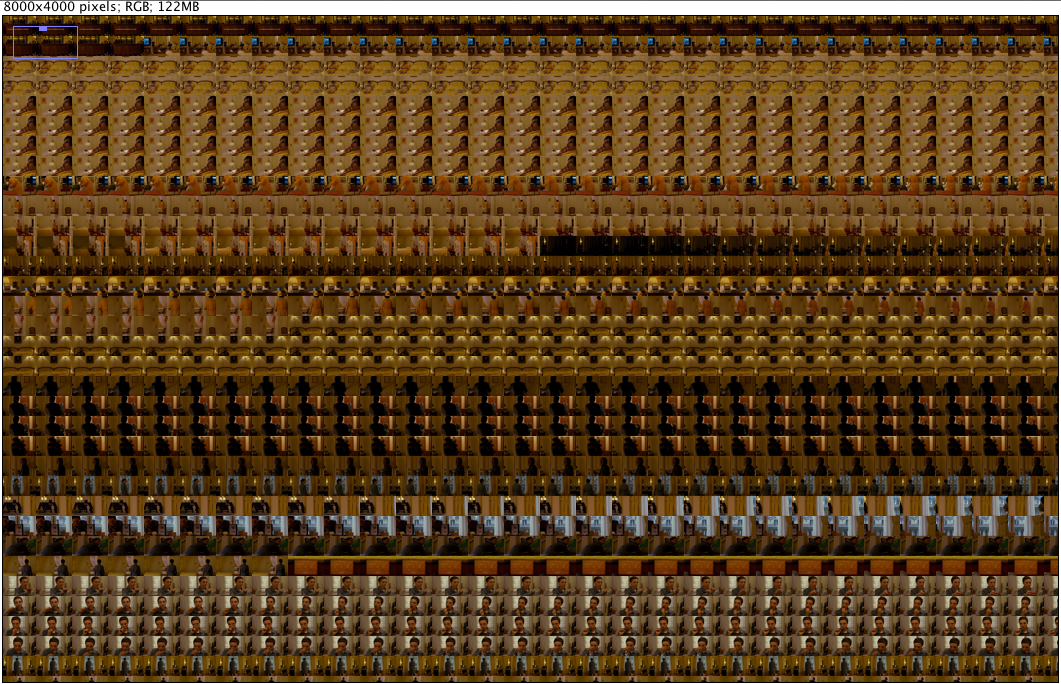
Both of these were made thanks to a handful of plug-ins I’ve yet to install on my Linux Machine.
So this is where I am at. It is probably clear that I have some work to do when it comes to using these tools for hard-nosed quantitative analysis, but this stuff is a rush to work with. I am either literally pulling chunks of hair out of my scalp or I’m inwardly cheering for myself when I finally get something working. Hopefully in the next month or so I’ll be able to slow down a tad and mesh some interesting writing with some well-formed data-vis… /p>