1. Initial Goal
My initial goal for this project was fairly straightforward – find a way to use our methods from class to gain a deeper understanding of Gravity’s rainbow – considered the pre-eminant postmodern text of the 20th century. This encyclopedic tome holds in it the kinds of deep structuring that is immidiately relevent to mathematical/computational examination… something I was not finding in initial public domain works. A perfect argument for the idea that the importance of digital humanities methods becomes much starker once the postmodern narrative comes into being.
2. Experimentation
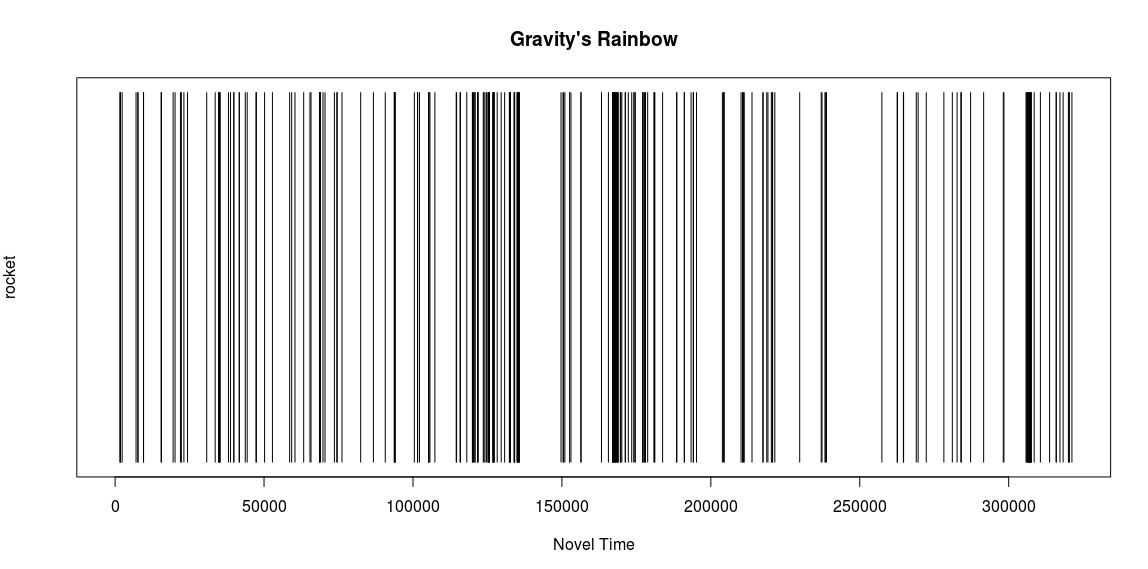
My first experiment with the book was simply to measure some word frequencies in the book using a tutorial from DHer Matthew Jockers. Searching words like “rocket” and “Slothrop” I was able to graphically plot the distribution of words. At that point I had not done enough close-readings of articles to understand how to get a meaningful set of “tokens” in which to use these methods to test a theory. If I could go back I think I would almost certainly plot specific tarot card titles. I may still go back and do this, but the more close reading I did, the more I found that there are scholars that contend the text holds specific hints that each section of the novel focuses on a different tarot figure.
3. Mathematics

Power Series (Pynchon, 142)

Yaw Control (Pynchon, 242)

Hilarious Graffiti of the Visiting Mathematicians (Pynchon, 457)
My next inclination was to examine the three explicit equations in the Gravity’s Rainbow text. This desire was spurred on by the reading of Lance Schachterle and P.k. Aravind’s article, “The Three Equations in Gravity’s Rainbow” Can these equations say something deep/new when somehow applied to data from the novel? I knew I would certainly not have time to examine all three in a tight time frame, so I chose the first of the equations – The Power Series – the most statistically relevent (as the R language I’ve been attempting to employ is traditionally software for statisticians).
4. Accepting Realities
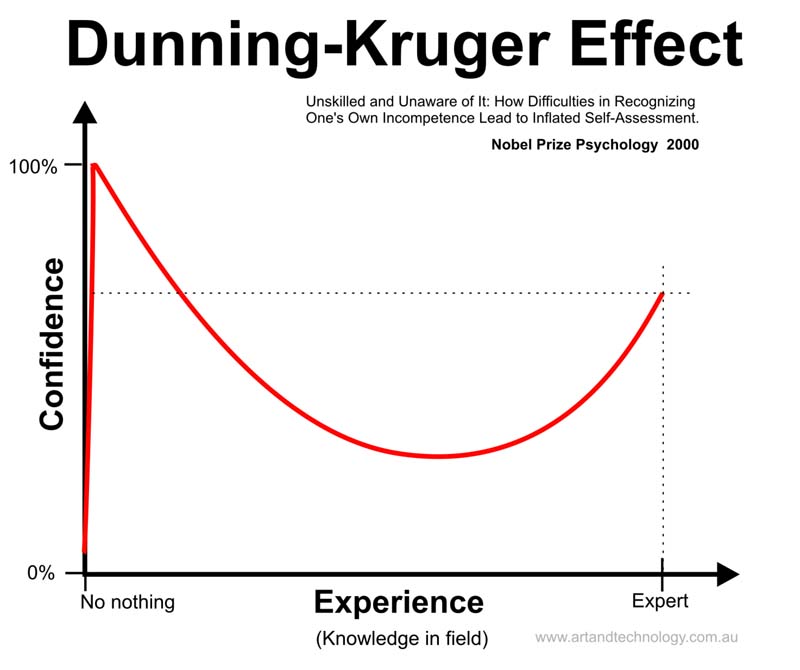
via http://artandtechnology.com.au (*Pretty sure ‘No Nothing’ is an intentional joke…)
After more research I began to feel I was suffering somewhat from the Dunning-Kruger effect – defined by wikipedia as a “cognitive bias in which unskilled individuals suffer from illusory superiority, mistakenly rating their ability much higher than average.” The reality is I was trying to rush headlong into a brand of mathematics I hadn’t worked with in more than a decade. This is not to say my research was in vain, far from it, merely I realized I had to put on the breaks and start handling my goals with gentler expectation.
5. Research Amalgamation
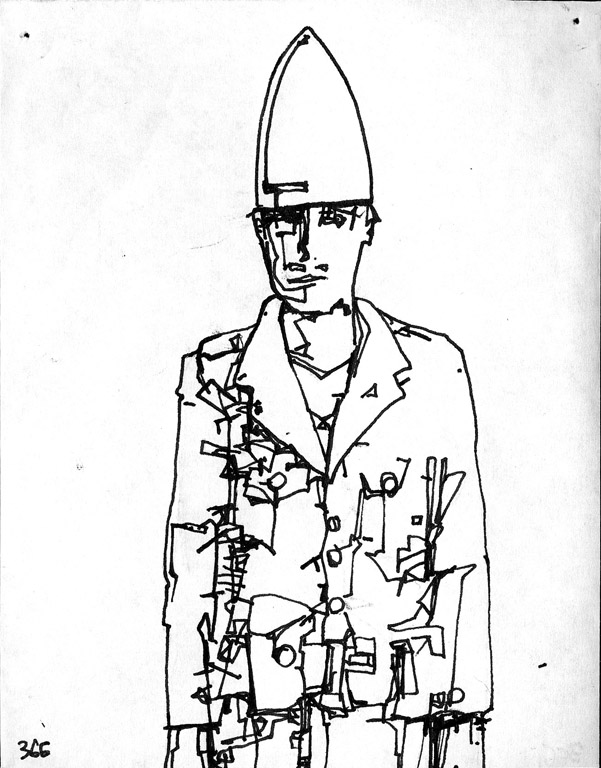
From Zak Smith’s Gravity’s Rainbow Illustrated
Rather than jumping headlong into trying to make sense of “The Power Series” I examined the text around it. The statistician, Roger Mexico, one of the 400 characters in Gravity’s Rainbow, was trying to examine data that inexplicably showed a correlation: The location of V2s dropped on London, the location of London births, and most importantly to the novel – the location of hardons/sexual encounters had between Tyrone Slothrop and a cavalcade of women. Tyrone Slothrop is the novel’s protagonist, but let me also say that this is the kind of text immune for a simple summarization. Tyrone Slothrop is explicitly a US Leutenant, but he may also be the ONLY character in the book, he very well may be a V2 rocket himself – attaining some kind of mad conciousness capturing some kind of abstract zeitgeist as he rises and falls as represented by a carefully constructed narrative. For every scholar that has attempted to study Gravity’s Rainbow there is a different interpretation of what exactly is happening in the text.

My last attempt to utilize methods was one step forward, and three illusory steps backward. I had to simplify my expectations based on time I had left to work on this project before presenting, and what my current skillsets were (are). I would find a way to recreate the map constructed by Tyrone Slothrop:
“The stars pasted up on Slothrop’s map cover the
available spectrum, beginning with silver (labeled “Darlene”) sharing a
constellation with Gladys, green, and Katharine, gold, and as the eye
strays Alice, Delores, Shirley, a couple of Sallys—mostly red and blue
through here—a cluster near Tower Hill, a violet density about
Covent Garden, a nebular streaming on into Mayfair, Soho, and out to
Wembley and up to Hampstead Heath—in every direction goes this
glossy, multicolored, here and there peeling firmament, Carolines,
Marias, Annes, Susans, Elizabeths. But perhaps the colors are only random, uncoded. Perhaps the girls are not even real”(Pynchon corpus, 682-691).“It’s the map that spooks them all, the map Slothrop’s been keeping on
his girls. The stars fall in a Poisson distribution, just like the rocket
strikes on Roger Mexico’s map of the Robot Blitz.
But, well, it’s a bit more than the distribution. The two patterns also
happen to be identical. They match up square for square. The slides that
Teddy Bloat’s been taking of Slothrop’s map have been projected onto Roger’s, and the two images, girl-stars and rocket-strike circles,
demonstrated to coincide. (Pynchon corpus, lines 3211-3217)”
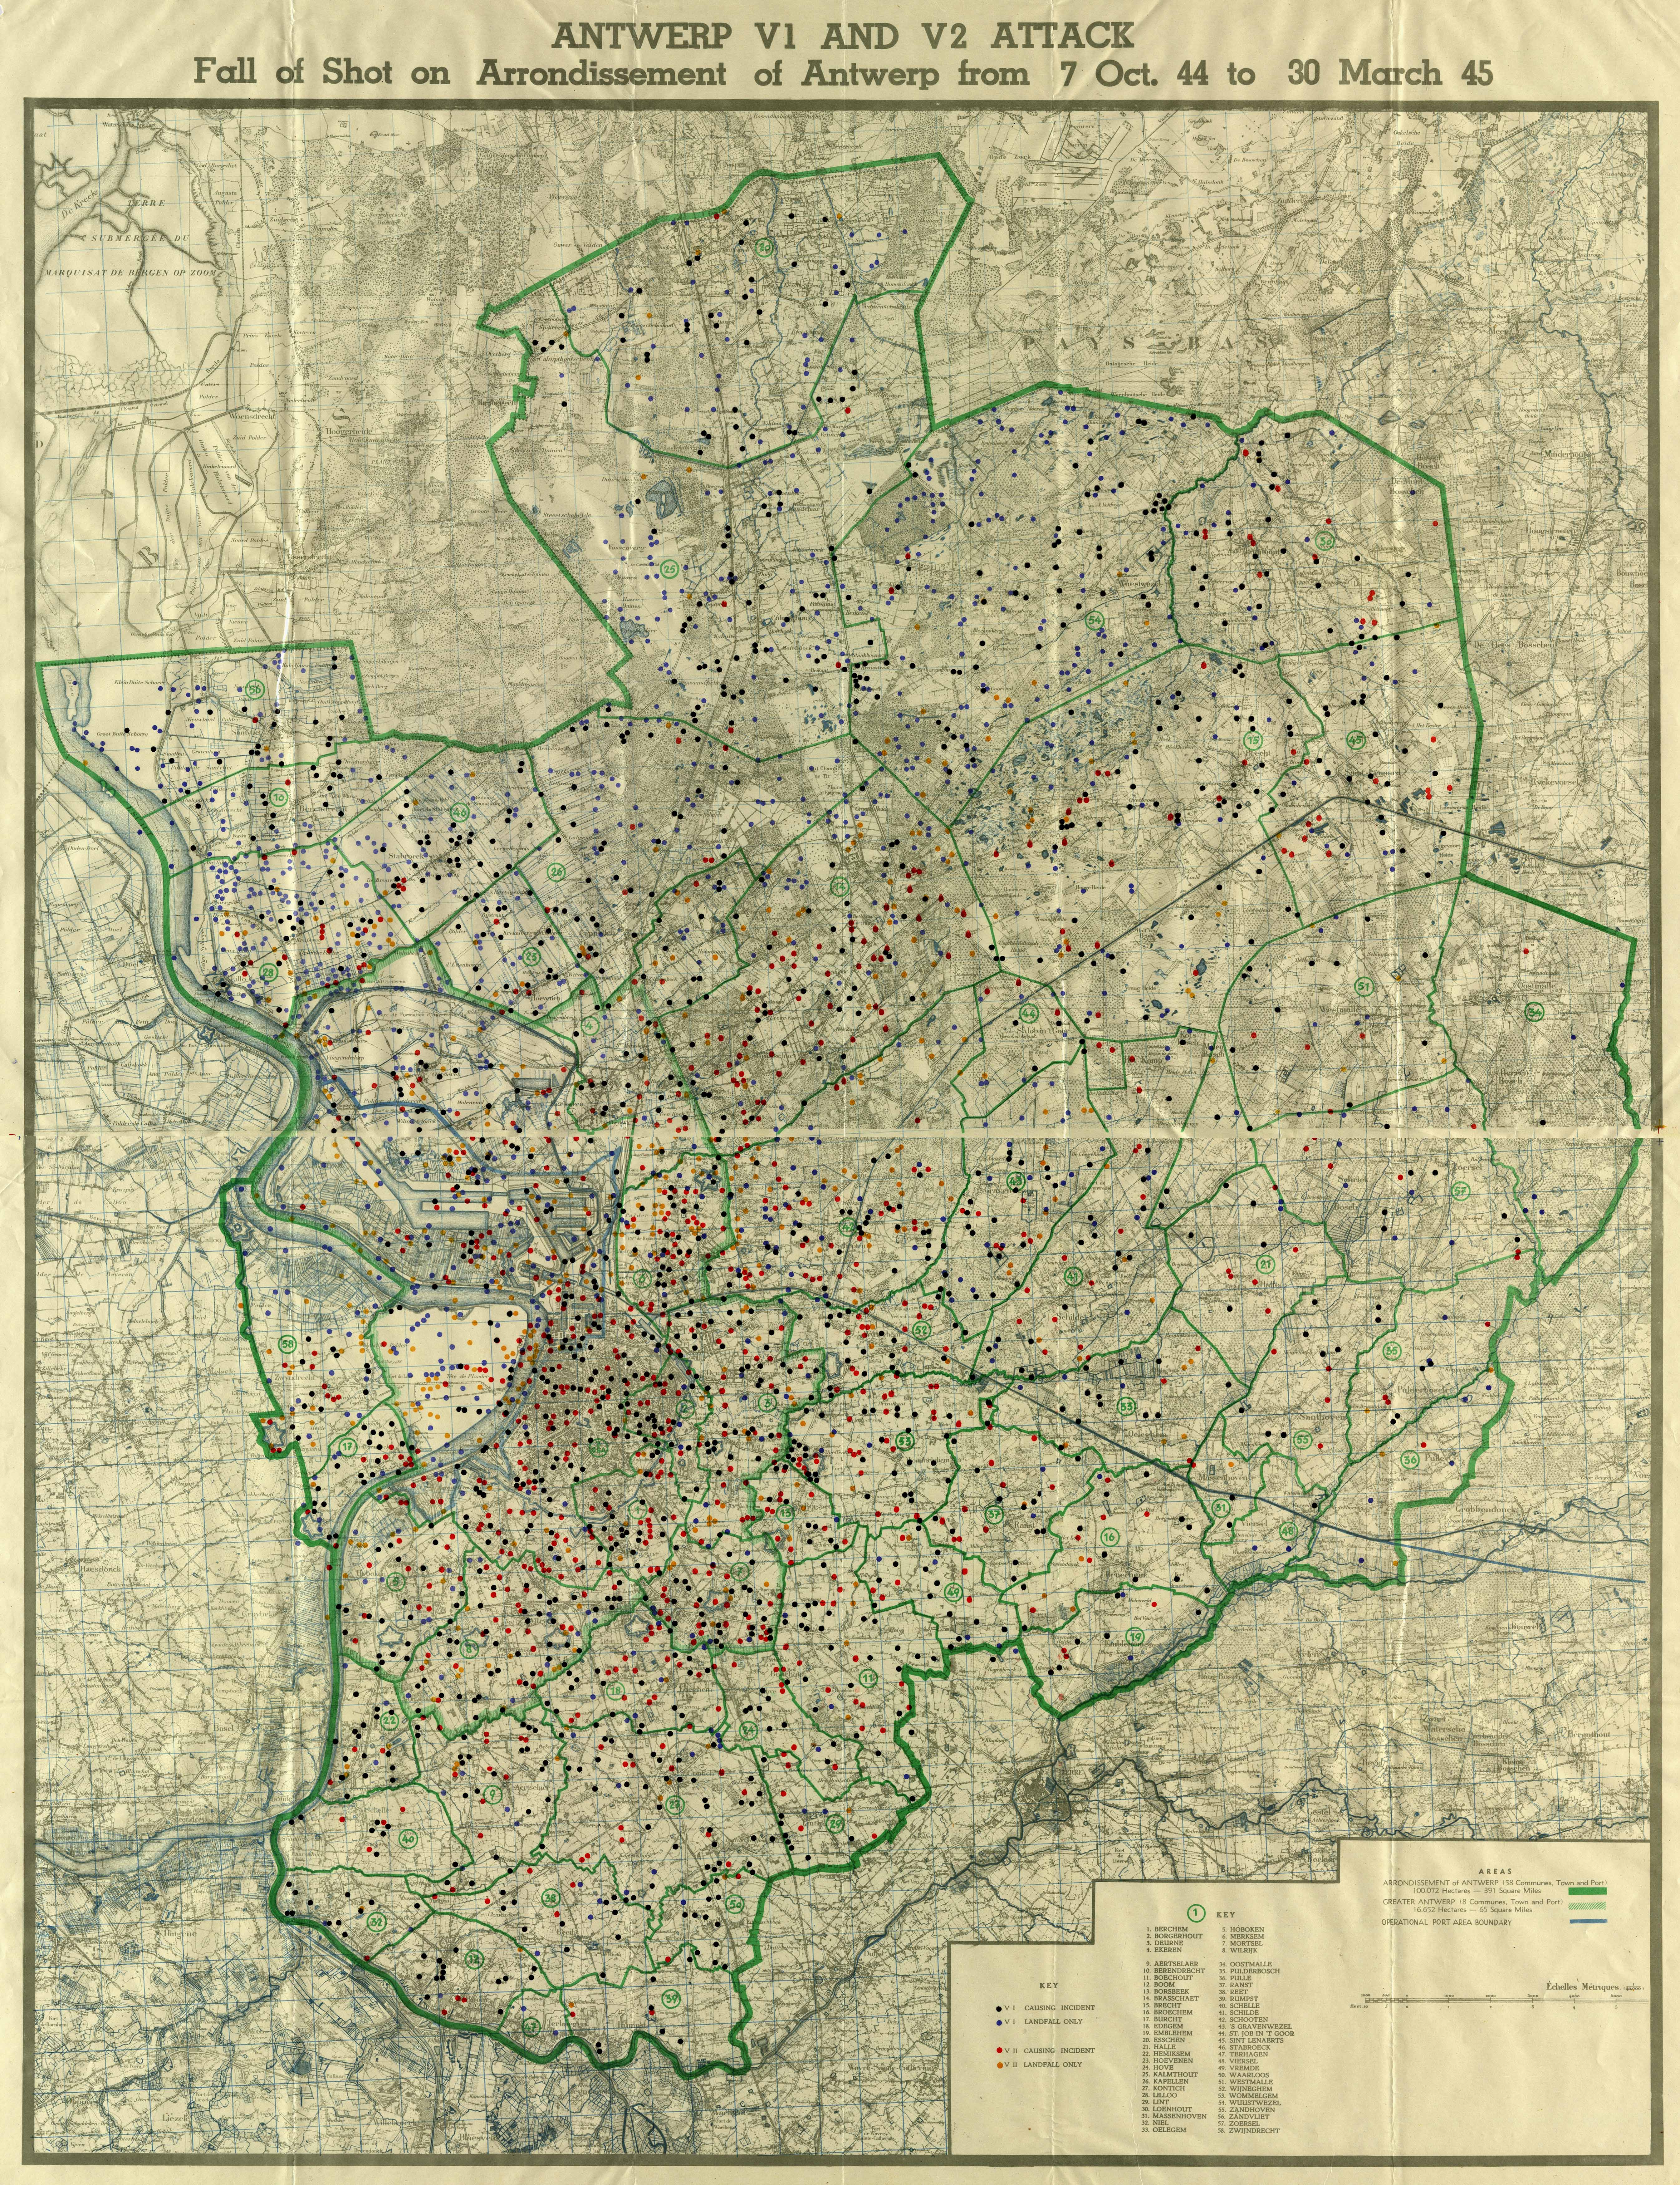
via http://www.v2rocket.com/start/chapters/antwerp.html
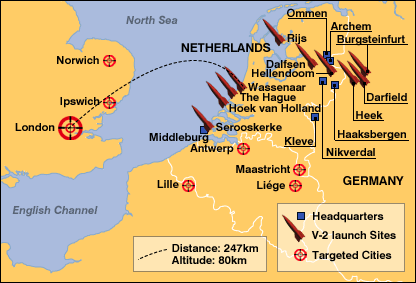
via http://newsimg.bbc.co.uk/media/images/40048000/gif/_40048350_v2_rocket2_map416.gif
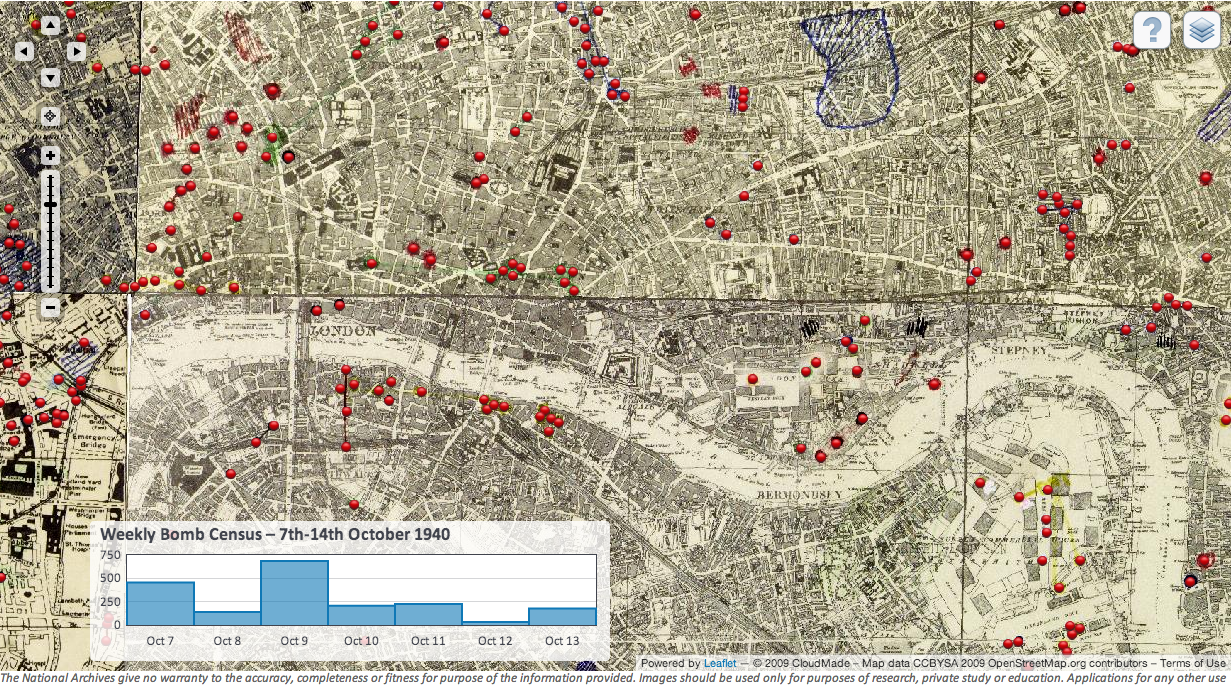
via http://bombsight.org/
However the deeper I looked, the more I found that while mathematical and data-centric devices employed in the book were valid one of two possibilities make the construction of this map either impossible or impossible for me. Why?:
1. The events of the book take place between December of 1944 and September 14 1945.
2. The final fall of the V2 rocket on a movie theater mirrors the Antwerp movie theater bombing of December 16, 1944.
SO: Time AND space are being played with through interconnecting implicit and explicit mathematical structures that would take years to correctly interpret (for this guy anyway)
or
SO: Pynchon is using his own fictional data and a precise recreation of this data in visualized form is impossible based on what the book reveals. This fictional data’s resemblance to actual data alongside valid mathematical structures in and around mathematical structure communicates ineffability/paranoia to the uninitiated reader, and black humour to the engineer.
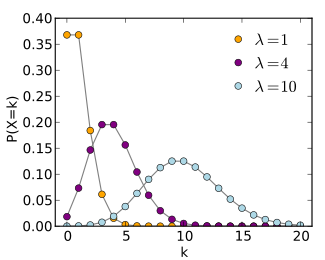
via http://en.wikipedia.org/wiki/Poisson_distribution
6. Conclusion
My failure to produce/make a neat, pretty visualization based on expected findings was a personal lesson in “ways of learning” in connection to digital pedagogy. In my attempt to construct a virtual “thing” I would contend I learned as much or more about this novel than I would have writing a traditional paper.
-In creating constraints that were interesting to me personally, I was exposed to a large number of visualizations showing how devestating the bombings in London during the second world war truly were.
-I learned more deeply about how a Poisson distribution is used and the difficulties in implementing such a distribution when trying to move beyond its simplest examples.
-I found structural clues worthy of further exploration (tarot references, pop culture references, etc)
If I had done a traditional close reading in today’s research environment in hopes of writing a paper, I no doubt would have been drawn to the most strictly literary reading possible. I would seek out symbols, nuances about specific characters, forms that could be recapitulated and regurgitated in a way that is all too prevelent in today’s more traditional forms of humanities scholarship. My drive to examine specific forms through utilization of empirical computational questions. I did as much, if not more, close reading as I would have crafting a traditional paper, yet the span of concepts I found outside those constraints I found to be just as informative, and in many cases more edifying. My ability at building maps in the R language for example was raised, my understanding of some (admittedly simple) distribution concepts grew in clarity. By moving outside of the text/explicit references to the text to ponder questions raised by the text was a valuable lesson on levels that a traditional paper would most likely not have satisfied.